Grip strength: the ageing marker in your hand
Grip strength is one of the simplest markers of how a body is ageing. In the PURE study of 139,691 adults aged 35 to 70 in 17 countries, every 5 kg less grip strength went with a 16 percent higher risk of death from any cause over a median of 4 years, and grip predicted death better than systolic blood pressure. In British normative data, grip peaks at a median of 51 kg in men and 31 kg in women in early adulthood and falls from the fifth decade to 39 kg and 24 kg at 70; below 27 kg for men and 16 kg for women, the European sarcopenia definition speaks of low muscle strength, though normal values differ by region.
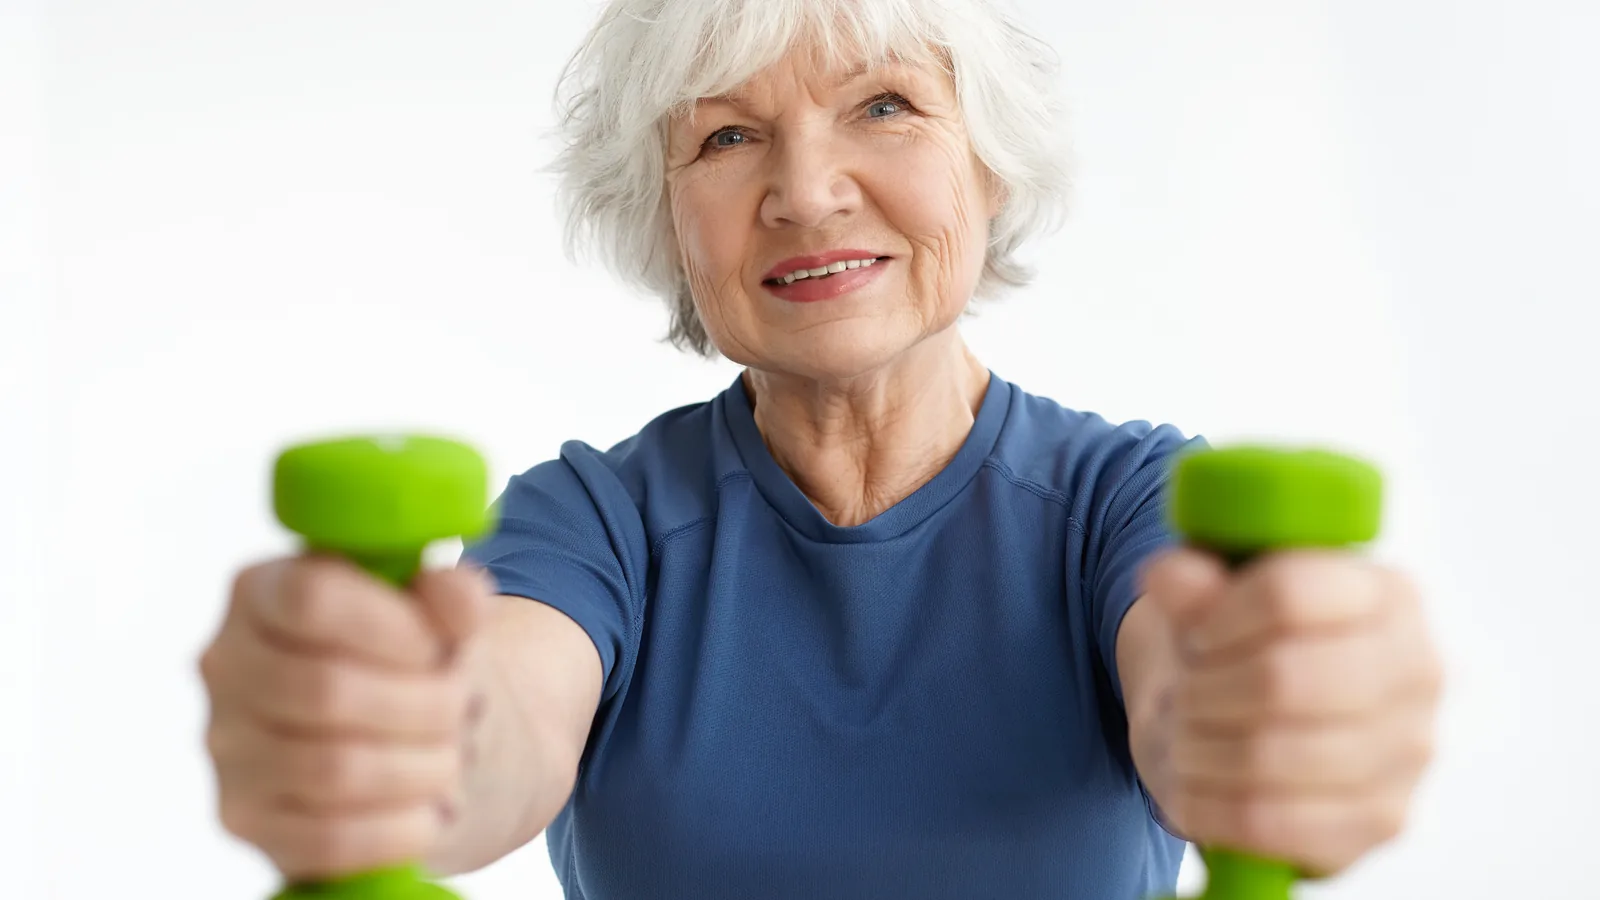
What a grip test measures
A grip test asks you to squeeze a hand dynamometer as hard as you can and reports the force in kilograms. One squeeze lasts 3 seconds, the 3 attempts per hand are spaced by at least 30 seconds of rest, and no laboratory is involved, which is why cohort studies could use it on hundreds of thousands of people. The European sarcopenia consensus notes that grip correlates moderately with strength in other parts of the body and treats it as a reliable stand-in for more complicated measures of arm and leg strength.
The protocol matters, because posture and device change the reading. The PURE investigators, who measured 125,462 healthy adults in 21 countries, had participants hold the dynamometer with the arm at the side and the elbow bent to 90 degrees, squeeze as hard as possible for 3 seconds, and repeat twice more with at least 30 seconds of rest; they kept the highest value from each hand and averaged the two.
Grip strength is a marker, not a diagnosis, and not a treatment target in its own right. A low reading can come from arthritis, a wrist injury or a nerve problem, and the studies below describe patterns across large groups, not a verdict on any one person.
| Age | Men, median | Women, median | Note |
|---|---|---|---|
| Peak | 51 kg | 31 kg | Men peak at 29 to 39, women at 26 to 42; the peak means at age 32 were 51.9 and 31.4 kg, the basis of the cut-offs |
| 40 | 50 kg | 31 kg | 10th to 90th centile: 38 to 63 kg men, 23 to 39 kg women |
| 50 | 48 kg | 29 kg | Decline starts in the fifth decade |
| 60 | 45 kg | 27 kg | About 5 kg below the value at 40 for men |
| 70 | 39 kg | 24 kg | 10th to 90th centile: 29 to 49 kg men, 16 to 31 kg women |
| 80 | 32 kg | 19 kg | 23.0 percent of men and 26.6 percent of women below the weak-grip line |
| 90 | 25 kg | 14 kg | Median for men now below the 27 kg cut-off; 10th to 90th centile 16 to 33 kg |
How grip strength changes with age
The clearest map of grip across life comes from Dodds and colleagues, who pooled 60,803 measurements from 49,964 people aged 4 to over 90 in 12 British population studies, taken between 1990 and 2012. Grip rises to a peak in early adulthood, holds through midlife and declines from the fifth decade. Men peaked at a median of 51 kg between ages 29 and 39, women at 31 kg between 26 and 42; the peak means, both at age 32, were 51.9 kg and 31.4 kg.
The fall is slow at first, then steeper. Median grip for men was 50 kg at 40, 45 kg at 60 and 32 kg at 80, so the median falls about 5 kg between 40 and 60 and about 13 kg between 60 and 80; for women the medians were 31 kg, 27 kg and 19 kg at those ages. The spread within one age is wide: at 70, the 10th and 90th centiles were 29 and 49 kg for men and 16 and 31 kg for women.
Weak grip, defined as at least 2.5 standard deviations below the sex-specific peak mean, works out at 27 kg for men and 16 kg for women. By age 80, 23.0 percent of men and 26.6 percent of women in these studies fell below that line. The data are cross-sectional, comparing different people at different ages, and the authors state that the centiles are likely to underestimate individual decline and should not be used to track one person over time. Each ten-year age group also spans at most 32 birth years, so part of the age pattern may be a cohort effect.
What a weaker grip predicts
Two large cohorts supply the headline numbers. The Prospective Urban Rural Epidemiology (PURE) study followed 139,691 adults aged 35 to 70 in 17 countries of high, middle and low income. Over a median follow-up of 4.0 years, 3,379 participants (2 percent) died. After adjustment, each 5 kg less grip strength was associated with a 16 percent higher risk of death from any cause, 17 percent higher cardiovascular and non-cardiovascular mortality, a 7 percent higher risk of myocardial infarction and a 9 percent higher risk of stroke. Grip predicted all-cause and cardiovascular death better than systolic blood pressure. It did not predict new diabetes, hospital admission for pneumonia or COPD, injury from a fall or fracture. One result ran the other way: in high-income countries a stronger grip went with a higher risk of cancer (hazard ratio 0.92 per 5 kg less grip), an association absent in middle-income and low-income countries.
UK Biobank, published in the BMJ in 2018, followed 502,293 people aged 40 to 69, 54 percent of them women, for a mean of 7.1 years, during which 13,322 (2.7 percent) died. Per 5 kg lower grip, all-cause mortality was 20 percent higher in women and 16 percent higher in men, cardiovascular mortality 19 and 22 percent higher, respiratory mortality 31 and 24 percent higher, and cancer mortality 17 and 10 percent higher. In a post hoc comparison per standard deviation, grip carried hazard ratios of 1.48 for all-cause and 1.57 for cardiovascular mortality, against 1.03 and 1.26 for systolic blood pressure. Adding grip to an office-based risk score improved its C index by 0.013, a real but modest gain, and the associations were modestly stronger in the younger age groups.
These are associations. People with weaker grip may already carry an illness that both weakens them and shortens their life (the BMJ authors name this reverse causation), and UK Biobank participants were healthier than the general population, with less obesity and smoking. The PURE authors add that whether improving strength reduces mortality or cardiovascular disease still has to be tested.
| Region | Men | Women |
|---|---|---|
| Europe and North America | 42 kg | 25 kg |
| South America | 37 kg | 23 kg |
| China | 36 kg | 23 kg |
| Middle East | 35 kg | 21 kg |
| Africa | 30 kg | 18 kg |
| South East Asia | 29 kg | 18 kg |
| South Asia | 27 kg | 19 kg |
Cut-offs, and why region changes them
The 2019 European consensus on sarcopenia (EWGSOP2) uses grip as its first test. Grip below 27 kg in men or below 16 kg in women counts as low muscle strength, and low strength alone means probable sarcopenia; adding low muscle quantity or quality confirms it, and adding poor physical performance, such as a walking speed of 0.8 metres per second or slower, makes it severe. The cut-offs come from the British life-course data above. The consensus is written for older people, though it notes that sarcopenia can begin earlier in life, and the figures are not meant for anyone under 18, whose grip is still climbing towards its peak.
A single global cut-off has a weakness. When the PURE group published reference ranges from 125,462 healthy adults aged 35 to 70 in 21 countries, median grip at 35 to 40 was 50 kg for men and 30 kg for women in Europe and North America, 45 and 28 kg in China, 35 and 23 kg in South Asia and 37 and 21 kg in Africa, up to 33 percent variation between regions within one age and sex band, and the gap is as wide at 61 to 70, as the second table shows. The authors concluded that readings should be interpreted against region-specific or ethnic-specific reference ranges. A man in Chennai with 30 kg at 65 sits above his regional median; the same reading in Manchester sits well below it.
What to do with your number
Physiotherapists, geriatric clinics and many sports centres have a dynamometer. Take the best of 3 attempts per hand, repeat on the same calibrated device once or twice a year, and compare against a table for your sex, age and region rather than the single European cut-off. Those tables place a single reading against people of your age; they are not a yardstick for your own rate of decline.
If the number is low or falling, the answer is not hand squeezers. Grip is a proxy for whole-body muscle, and the guide on strength training after 40 sets out how progressive resistance training on 2 or more days a week raises strength in later life, alongside enough protein (the protein by age guide gives the figures). Walking speed is the companion marker, and the walking speed guide covers the 0.8 metres per second threshold.
See a doctor rather than a table if one hand is suddenly much weaker than the other, if weakness came on over days or weeks, or if it comes with numbness, tingling, unexplained weight loss or breathlessness: these point to nerve, joint or systemic disease rather than ageing. If you have heart disease, uncontrolled blood pressure, a recent hand or wrist injury, or you are pregnant, ask a doctor or physiotherapist before squeezing at maximal effort, since a hard squeeze with the breath held raises blood pressure briefly. A single low reading in an otherwise well person is a prompt to build strength and retest, not a diagnosis.
Testing grip strength the standard way
- Arm at your side, elbow bent to 90 degrees, the same position every time
- Squeeze as hard as you can for 3 seconds, then rest at least 30 seconds
- Make 3 attempts per hand and keep the highest value for each hand
- Record both hands and note which is dominant
- Use the same calibrated device each time, because models differ
- Compare with a table for your sex, age and region, not one global cut-off
- Retest once or twice a year and watch the trend
- Skip the test with an acute hand or wrist injury
Frequently asked
What is a normal grip strength for my age?
In 12 British studies the median was 50 kg for men and 31 kg for women at 40, 45 and 27 kg at 60, and 39 and 24 kg at 70. The spread is wide: at 70, the 10th to 90th centile range was 29 to 49 kg for men and 16 to 31 kg for women.
Is 27 kg for men and 16 kg for women the threshold everywhere?
No. Those are the 2019 European cut-offs for low muscle strength, derived from British data. Medians differ by up to 33 percent between world regions in the PURE reference ranges, so the authors advise region-specific tables.
Can I raise my grip strength?
Yes. Grip mirrors overall muscle, so progressive resistance training on 2 or more days a week, with enough protein, is the route rather than hand squeezers alone. Whether a stronger grip in itself lowers mortality has not been tested in a trial, as the PURE authors note.
Is grip strength really a better predictor than blood pressure?
For death, yes, in both PURE and UK Biobank. In UK Biobank, per standard deviation, grip carried hazard ratios of 1.48 for all-cause and 1.57 for cardiovascular mortality, against 1.03 and 1.26 for systolic blood pressure. For new cardiovascular disease the two were close, 1.29 against 1.30, and blood pressure remains the one you can treat directly.
Does a weak grip mean I am likely to fall?
Not in PURE, which found no significant association between grip and injury from falls or fractures over a median of 4 years. The European sarcopenia guideline still treats low grip as a marker of poor outcomes and pairs it with a chair stand test, where more than 15 seconds for five rises signals low strength.
Do I need a dynamometer?
For the number, yes, and it should be the same calibrated device each time. Without one, the chair stand test from the European guideline is the substitute: time five rises from a chair without using your arms, and more than 15 seconds indicates low strength.
Sources
- Leong et al. 2015, The Lancet: Prognostic value of grip strength, findings from the Prospective Urban Rural Epidemiology (PURE) study · 139,691 adults aged 35 to 70 in 17 countries, median follow-up 4.0 years, 3,379 deaths; hazard ratio per 5 kg reduction 1.16 all-cause, 1.17 cardiovascular, 1.17 non-cardiovascular, 1.07 myocardial infarction, 1.09 stroke; stronger predictor than systolic blood pressure; no association with incident diabetes, hospital admission for pneumonia or COPD, injury from a fall or fracture; grip positively associated with cancer in high-income countries (0.92). DOI resolves to the publisher page
- Celis-Morales et al. 2018, BMJ: Associations of grip strength with cardiovascular, respiratory, and cancer outcomes and all cause mortality, prospective cohort study of half a million UK Biobank participants · 502,293 participants aged 40 to 69, 54 percent women, mean follow-up 7.1 years, 13,322 deaths; hazard ratio per 5 kg lower grip 1.20 women and 1.16 men for all-cause mortality; per standard deviation 1.48 and 1.57 against 1.03 and 1.26 for systolic blood pressure; C index change 0.013. Open access copy on PubMed Central
- Dodds et al. 2014, PLOS ONE: Grip strength across the life course, normative data from twelve British studies · 60,803 observations from 49,964 participants aged 4 to 90 plus; peak 51 kg men aged 29 to 39, 31 kg women aged 26 to 42; medians by decade; weak grip at 2.5 standard deviations below peak equals 27 kg men and 16 kg women; 23.0 percent of men and 26.6 percent of women weak by 80; cross-sectional data. Open access copy on PubMed Central
- Cruz-Jentoft et al. 2019, Age and Ageing: Sarcopenia, revised European consensus on definition and diagnosis (EWGSOP2) · Low muscle strength below 27 kg men and 16 kg women; chair stand more than 15 seconds for five rises; gait speed 0.8 metres per second or slower; probable, confirmed and severe sarcopenia; SARC-F screen. Open access copy on PubMed Central
- Leong et al. 2016, Journal of Cachexia, Sarcopenia and Muscle: Reference ranges of handgrip strength from 125,462 healthy adults in 21 countries, a PURE study · Median grip by age band and region for men and women; up to 33 percent variation between regions; protocol with elbow at 90 degrees, 3 second squeeze, 3 attempts per hand with at least 30 seconds rest; region-specific reference ranges advised. Open access copy on PubMed Central
Read on
 Health
Strength training after 40: how much is enough
Health
Strength training after 40: how much is enough
 Longevity
Walking speed: the vital sign you can time with a watch
Longevity
Walking speed: the vital sign you can time with a watch
 Longevity
VO2 max: the fitness number that predicts survival
Longevity
VO2 max: the fitness number that predicts survivalTools that fit
This guide is for general information. It does not replace medical advice or an examination.